
Thinking about going solar? You’ve probably found yourself looking up at the sky, wondering, “How much sunlight do I actually get?” It’s a logical first step, but the number of daylight hours from sunrise to sunset is one of the most misunderstood metrics in solar energy. While it seems straightforward, more daylight doesn’t always equal more solar power.
The key to unlocking your home’s solar potential lies in understanding the quality of that sunlight, not the quantity. This is where the industry’s most important metric comes in: Peak Sun Hours (PSH).
This guide will walk you through what peak sun hours are, how they differ across the United States, and how you can use this knowledge to plan the perfect solar panel system for your home.
What Exactly Are Peak Sun Hours?
A peak sun hour isn’t just any hour of daylight. It’s an hour during which the intensity of solar irradiance (sunlight hitting a surface) reaches an average of 1,000 watts per square meter (1kW/m²). This is the “golden hour” for solar production when your panels are working at their maximum potential.
Think of it like watering your garden with a hose. The total “daylight hours” are the entire time you have the water on, from a trickle in the morning to a trickle in the evening. Peak sun hours are the hours you have the nozzle twisted to full blast. Even if the water is on for 12 hours, you might only get 5 hours’ worth of “full blast” watering.
The sun’s energy works the same way. In the early morning and late afternoon, the sun is at a low angle. The atmosphere is thicker, and the light is less intense, causing your panels to produce less power. At midday, when the sun is high overhead, your panels receive direct, intense energy and generate peak power.
PSH bundles all of this variable daily sunlight into a simple, standardized number that tells you how many “full power” hours your location gets. It’s expressed as kilowatt-hours per square meter per day (kWh/m²/day). So, if your location receives 5 PSH, it means it gets the energy equivalent of 5 hours of peak 1,000 W/m² sunlight.
Understanding this concept is important because it directly impacts your system’s energy production and your return on investment. Two homes with identical solar systems can produce vastly different amounts of electricity based solely on their peak sun hours.

How to Calculate Your Solar System’s Potential Production
Understanding PSH is what allows solar installers to move from a rough guess to a precise energy production estimate. The formula is simple:
Daily Energy Production (kWh) = Solar System Size (kW) × Peak Sun Hours (PSH)
Let’s use a real-world example. Imagine you’re installing an 8-kilowatt (kW) residential solar system in Charlotte, North Carolina, which receives an annual average of about 5 peak sun hours.
● Daily Energy: 8 kW × 5 PSH = 40 kWh ● Annual Energy: 40 kWh × 365 days = 14,600 kWh
This calculation gives you a baseline for how much energy your system will produce annually. You can then compare this number to your utility bills (which are also measured in kWh) to determine how much of your electricity usage will be offset by solar.
Beyond the Basic Formula
While the PSH calculation is your best starting point, a professional solar estimate will also account for several real-world efficiency factors to give you the most accurate forecast:
Shading: Any shadows from trees, chimneys, or nearby buildings can reduce energy output by 10-50% depending on the severity and timing of the shade.
Panel Orientation & Tilt: The angle and direction your panels face have a big impact on PSH. South-facing panels at the optimal tilt can capture 100% of available PSH, while east or west-facing panels might capture 85-90%.
Equipment Efficiency: Inverters operate at 95-98% efficiency, while wiring and other components contribute small losses that can total 2-5% of your system’s potential output.
Soiling & Weather: Dust, pollen, snow, and even a string of cloudy days can temporarily affect production. Most areas see a 2-5% annual reduction from soiling.
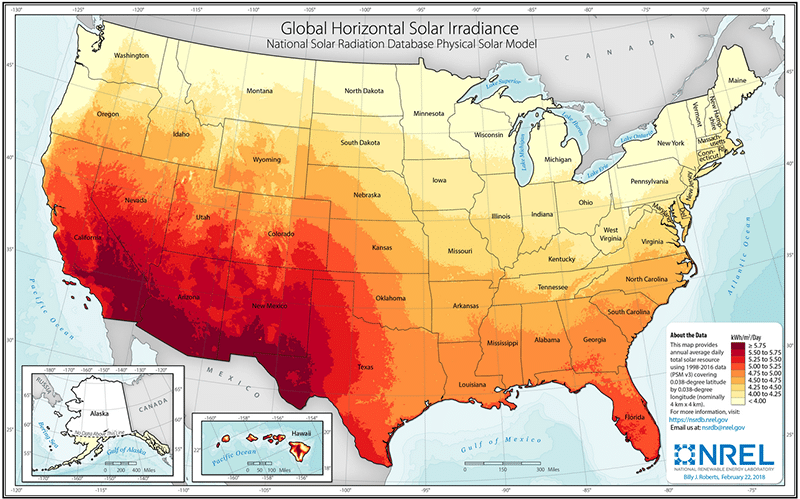
Peak Sun Hours by Location: A National Overview
Solar potential isn’t distributed equally across the country. The amount of direct sunlight a region receives is influenced by latitude, climate, and weather patterns. The Southwest enjoys clear advantages due to high elevation, low humidity, and minimal cloud cover.
Peak Sun Hours by State (Annual Average)
Here’s a breakdown of the average peak sun hours by location for various states:
| State | Major City | Average Daily Peak Sun Hours (PSH) |
| Arizona | Phoenix | 6.5 – 7.5 |
| California | Los Angeles | 5.5 – 6.5 |
| Nevada | Las Vegas | 6.5 – 7.0 |
| New Mexico | Albuquerque | 6.5 – 7.0 |
| Florida | Miami | 5.0 – 5.5 |
| Texas | Austin | 5.0 – 6.0 |
| Colorado | Denver | 5.5 – 6.0 |
| Georgia | Atlanta | 4.5 – 5.0 |
| North Carolina | Raleigh | 4.5 – 5.0 |
| South Carolina | Charleston | 4.5 – 5.0 |
| Illinois | Chicago | 4.0 – 4.5 |
| Ohio | Columbus | 4.0 – 4.5 |
| New York | New York City | 4.0 – 4.5 |
| Pennsylvania | Philadelphia | 4.0 – 4.5 |
| Massachusetts | Boston | 4.0 – 4.5 |
| Washington | Seattle | 3.5 – 4.0 |
| Oregon | Portland | 3.5 – 4.5 |
Even states with lower PSH values like New York and Washington have booming solar markets. Why? High local electricity prices make solar a fantastic investment, even with less intense sun. The key is to size the system correctly based on the available PSH.
For example, a homeowner in Seattle might need a 10kW system to generate the same annual energy as an 8kW system in Phoenix. The economics can still work beautifully when electricity rates are high enough to justify the additional panels.
Factors That Influence Your Home’s PSH
Beyond your state’s average, the peak sun hours your roof receives depend on site-specific factors. An expert installer will analyze these to maximize your system’s output.
1. Seasonality
How much sunlight per day you get changes throughout the year. The sun is higher in the sky and visible for longer during the summer, leading to higher PSH values. In winter, the sun is lower, and the days are shorter, reducing PSH.
For example, in Raleigh, a south-facing system might get 5.7 PSH in May but only 3.8 PSH in January. Your annual average smooths out these variations, but understanding seasonal patterns helps explain why your summer electric bills might be eliminated while winter bills remain higher.
2. Roof Orientation (Azimuth)
In the Northern Hemisphere, the ideal orientation for solar panels is true south. This exposure captures the most direct sunlight as the sun travels across the southern sky. East- and west-facing roofs are also viable but will produce slightly less energy.
Here’s how orientation affects your PSH utilization:
● South-facing: 100% of available PSH
● Southeast/Southwest: 95-100% of available PSH
● East/West-facing: 85-90% of available PSH
● North-facing: 60-70% of available PSH (generally not recommended)
3. Roof Tilt (Pitch)
The best tilt angle for solar panels is one that maximizes year-round sun exposure. A rule of thumb for maximizing annual production is to set the tilt angle equal to your home’s latitude.
In Raleigh (35° latitude), a 35-degree tilt is ideal. Most residential roofs have a pitch between 30 and 40 degrees, making them excellent candidates for solar without requiring special mounting equipment.
Steeper roofs (45+ degrees) work well in northern climates where the winter sun is low in the sky. Flatter roofs (15-25 degrees) can be ideal in southern regions where the sun is high year-round.
4. Local Weather Patterns
Your area’s weather patterns impact how many days of sunshine by state you experience. Desert regions like Arizona benefit from clear skies 300+ days per year, while coastal areas might have frequent marine layer or fog that reduces morning peak sun hours.
Understanding these patterns helps explain why two cities at the same latitude can have very different PSH values. San Diego and Atlanta are at similar latitudes, but San Diego’s Mediterranean climate provides consistently clearer skies and higher PSH values.
Maximizing Your Solar Investment
Understanding peak sun hours empowers you to make informed decisions about solar panel placement, system sizing, and realistic energy production expectations. Here are strategies to optimize your investment:
Work with Local Experts: Solar installers familiar with your area’s specific PSH patterns, weather challenges, and utility policies can design systems that maximize your return on investment.
Consider Time-of-Use Rates: Many utilities charge higher rates during peak afternoon hours when your solar system produces the most power. Understanding your PSH helps you align maximum production with maximum savings.
Plan for Seasonal Variation: Size your system based on annual averages, but understand that winter months may require grid electricity while summer months might generate excess power for net metering credits.
Go Solar With Confidence
Don’t let confusing metrics cloud your path to clean energy. Peak sun hours demystify solar potential, transforming a complex environmental factor into a simple number that empowers you to make smart decisions. By understanding your location’s PSH, you can accurately estimate energy production, calculate your return on investment, and make sure your solar panel system is sized to meet your financial and environmental goals.
Whether you’re in sunny Arizona with 7+ PSH or cloudy Seattle with 3.5 PSH, solar can deliver huge savings when properly planned. The key is working with experienced professionals who understand how to harness your area’s unique solar resource.
Ready to find out the exact peak sun hours for your specific roof? Stop guessing about your solar potential. At 8MSolar, our experienced team analyzes your home’s conditions including roof orientation, shading, and local weather patterns to provide accurate production estimates. Get a personalized solar production estimate for your location. Schedule a free solar consultation now!
For simplicity, these numbers don’t represent any real world degradations, losses and inefficiencies.