
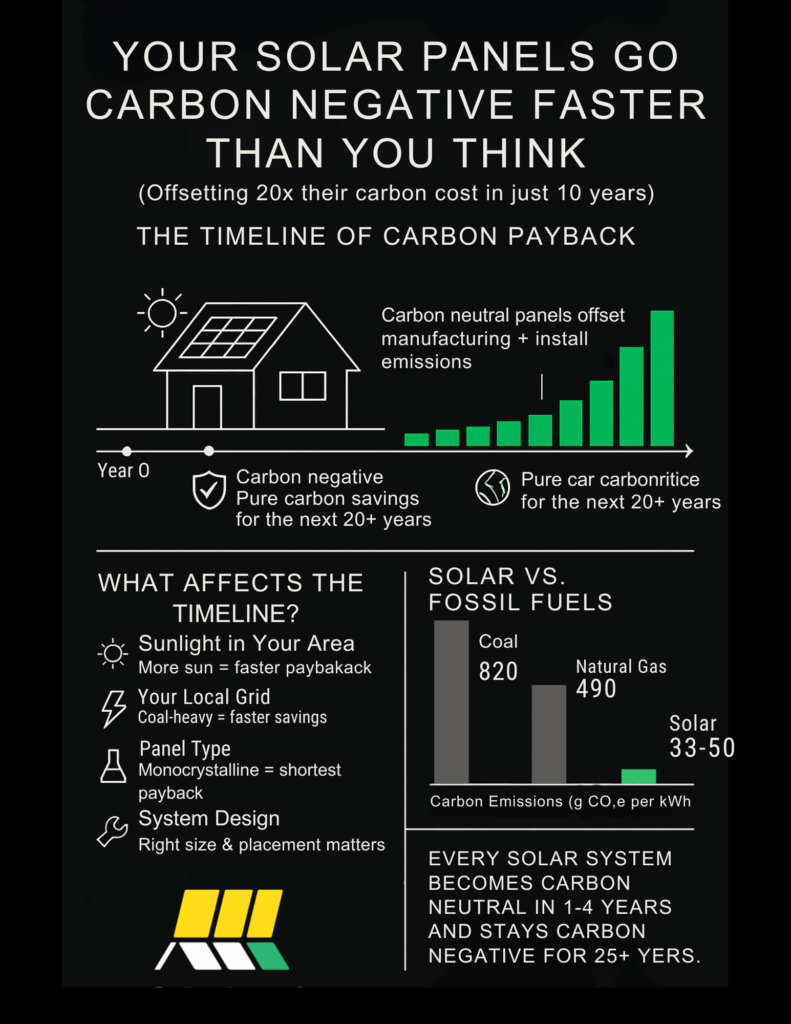
Solar panels installed today will prevent more than 20 times the carbon emissions created during their manufacturing within their first decade of operation. This environmental turnaround is one of the most compelling reasons homeowners across North Carolina are making the switch to solar energy.
When you’re considering solar panels for your home, you want to know the environmental impact of your investment. The term “carbon negative” refers to the point when your solar system has generated enough clean energy to offset all the carbon emissions created during its manufacturing, transportation, and installation—and then continues producing emission-free electricity for years beyond that break-even point.
This timeline matters because it affects the environmental value of your solar investment. Understanding when your panels become carbon negative helps you make an informed decision about solar adoption and gives you confidence that you’re making a contribution to reducing greenhouse gas emissions. For most homeowners, this payback happens much faster than you might expect.
In this guide, you’ll discover the timeframe for solar’s carbon payback, learn what factors influence this timeline in your area, and understand how modern solar technology has improved its environmental impact over the past decade. You’ll also see why solar’s carbon timeline keeps getting better and how you can maximize the environmental benefits of your solar investment.
Solar’s Carbon Payback Timeline
Modern solar panels achieve carbon neutrality quickly, typically within 1 to 4 years of installation. Research has shown that the carbon payback period for solar panels is on average 1-4 years, with the average solar panel in Europe offsets its emissions in either 1.18 years if it was made in China, or 1.05 years if it was produced in Europe.
Understanding Carbon Neutral vs. Carbon Negative
To grasp why this timeline matters, it’s important to understand the difference between carbon neutral and carbon negative. Carbon neutrality occurs when the overall carbon dioxide emissions generated by a product or service, i.e., a solar power system, become equal to zero. This is the point where your solar panels have generated enough clean energy to offset all emissions released during their manufacturing, transportation, and installation.
Carbon negative goes a step further. Carbon negative refers to when a company, organization, or country removes more carbon dioxide from the atmosphere than it emits. For solar panels, this means they continue producing emission-free electricity for decades after achieving carbon neutrality, actively reducing your home’s carbon footprint.
What Influences Your Timeline
Several factors determine when your solar system becomes carbon negative. The biggest influence is your location and local sunlight conditions. A typical solar panel will save over 900kg of CO2 per year, but panels in sunnier climates reach carbon neutrality faster than those in cloudier regions.
The type of solar panel also matters. There are three different types of solar panels, monocrystalline, polycrystalline, and thin film which are each manufactured differently which means they each leave a different-sized carbon footprint. Modern monocrystalline panels, which are the most common for residential installations, have the shortest payback periods.
Your local electricity grid plays a role too. If your area relies heavily on coal or natural gas for electricity, your solar panels will offset more carbon emissions compared to regions with cleaner grid electricity. This accelerates your path to carbon negativity.
Understanding Solar’s Carbon Footprint
To understand why solar panels achieve carbon neutrality so quickly, we need to examine where their emissions come from. The carbon footprint of solar panels comes from manufacturing, transportation, and installation. Let’s break down each component with real data to give you the complete picture.
Manufacturing: The Largest Source of Solar’s Carbon Footprint
The carbon footprint of manufacturing solar panels accounts for roughly two-thirds of the life-cycle emissions of solar energy. This manufacturing phase includes several energy-intensive processes that contribute to the carbon footprint.
The biggest contributor is polysilicon production. Polysilicon production accounts for half of the total carbon emissions associated with solar panel manufacturing. Studies show that silicon manufacturing accounts for around 6.0 kg CO2e/kg per silicon metal made. The process requires refining silicon from quartz at temperatures of 1,500-2,000°C, which demands enormous amounts of electricity.
Solar panel manufacturing produced more than 51.9 million tonnes of CO2 in 2021, according to the IEA. Its footprint equates to 0.15% of the world’s energy-related emissions. While this might sound significant, it’s a tiny fraction of global emissions—and importantly, these emissions are offset by the clean energy the panels produce.
The manufacturing location affects the carbon footprint. China is responsible for half of the world’s production of photovoltaic panels and produces double the emissions per panel compared to Western countries. This happens because China’s electricity grid relies heavily on coal-fired power plants to run manufacturing facilities.
Transportation
Transportation emissions only make up 3% of a solar panel’s total carbon footprint. However, understanding this component helps explain regional variations in carbon payback times.
Most solar panels are manufactured in China and shipped globally. A container can transport many panels, but shipping one from Shanghai to Los Angeles emits enough CO2. Road and rail transport add emissions. The weight of glass and aluminum frames increases fuel consumption during transportation.
62% of solar transportation emissions come from Chinese exports, reflecting the global nature of the solar supply chain. Moving panels from ports to inland installation sites adds additional transportation emissions per panel.
Installation
Installation contributes a relatively small portion to solar’s overall carbon footprint. The total carbon emissions generated during manufacturing and installation are calculated in line with several factors. These include: The mining of raw materials used to create the panels, Construction and assembly of the product using these raw materials, Transportation between manufacturer and distributor, Installation of the panels on your home by a reputable supplier.
The installation process itself requires minimal energy compared to manufacturing. Most emissions come from the vehicles and equipment used to transport and install the panels on your roof.
How Different Panel Types Compare
The three main types of solar panels have different carbon footprints based on their manufacturing processes:
Monocrystalline Panels: Monocrystalline panels are made by cutting a block of silicon into small wafers. This is a complex process and produces the highest emissions, compared to other solar panel manufacturing processes. Despite higher initial emissions, these panels offer the best efficiency and longest lifespan, making them the most carbon-effective choice over their lifetime.
Polycrystalline Panels: Polycrystalline solar panels are also made of silicon, but these crystals are melted together and then placed onto the panel. This still requires electricity, but not as much as monocrystalline panels. This simpler process results in lower manufacturing emissions but slightly reduced efficiency.
Thin-Film Panels: Thin-film solar panels leave a smaller carbon footprint compared to the other two types of solar panels, but are less utilized because they are created from toxic materials and can cause environmental harm if not handled properly. While they have the lowest manufacturing emissions, their lower efficiency means you need more panels to generate the same amount of electricity.
When you put all these numbers in perspective, solar’s carbon footprint is remarkably low. According to the IPCC, the carbon footprint of rooftop solar panels is roughly 12 times less than natural gas and 20 times less than coal, in terms of CO2 emissions per kWh of electricity generated. Solar panels emit around 50g of CO2 per kWh produced in its first few years of operation.
For comparison, coal-fired power plants, the average lifecycle emissions is 820 g CO2e/kWh. Meanwhile, gas combined cycle plants release 490 g CO2e/kWh, and utility-scale solar PV systems only 33-50 g CO2e/kWh. This massive difference is why solar panels achieve carbon neutrality so quickly and become strongly carbon negative for the remainder of their 25-30 year lifespan.
Factors That Affect Carbon Payback Time
Not all solar installations reach carbon neutrality on the same timeline. Your specific carbon payback time depends on several factors that can speed up or slow down your journey to carbon negativity. Understanding these variables helps you optimize your solar investment for maximum environmental impact.
1. Where You Live Makes All the Difference
Geographic Location and Sunlight Exposure
Your location is the biggest factor affecting your solar system’s carbon payback time. Solar system performance is closely linked to geographic location. Sun Belt states like Arizona and Nevada benefit from more sun, leading to shorter payback periods. Conversely regions with frequent cloud cover or shorter daylight hours may have a longer payback period.
Here’s how different regions compare:
- High-Sunlight Regions (Arizona, Nevada, Southern California): 1-2 years for carbon neutrality
- Moderate-Sunlight Regions (North Carolina, Virginia, Texas): 2-3 years for carbon neutrality
- Lower-Sunlight Regions (Pacific Northwest, Northern states): 3-6 years for carbon neutrality
Even in areas where the sun’s radiation is received at less than 550kWh per m2 like the northern part of the UK, a typical solar panel will only take around 6 years to pay back its energy cost. This shows that even in cloudy climates, solar panels achieve carbon neutrality well within their 25-30 year lifespan.
Peak sun hours in your area directly impact energy production. Illinois averages 3-4 peak sun hours per day. During this time, your solar panels will get close to 1,000 watts of solar energy per square meter. In comparison, Texas averages 4.5-6 peak sun hours per day, meaning a solar system in Austin could generate more energy than the same system in Chicago.
2. Panel Efficiency and Technology Drive Performance
How Panel Technology Affects Carbon Payback
Different solar panel technologies achieve carbon neutrality at different speeds based on their efficiency and manufacturing footprint. High-efficiency solar panels generate more electricity per square foot, which accelerates the carbon payback timeline.
The energy payback times and carbon footprints are 1.96, 1.24, 1.39, 0.92, 0.68, and 1.02 years and 38.1, 27.2, 34.8, 22.8, 15.8, and 21.4 g CO2-eq/kWh for monocrystalline silicon, multicrystalline silicon, amorphous silicon, “micromorph” silicon, cadmium telluride and CIGS roof-top photovoltaic systems, respectively.
Modern High-Efficiency Panels vs. Older Technology
Today’s solar panels are more efficient than panels from a decade ago. Modern monocrystalline panels achieve 20-22% efficiency, compared to 15-18% for older models. This higher efficiency means each panel generates more clean energy per square foot, offsetting its manufacturing emissions faster.
Panel efficiency directly impacts your carbon payback time because more efficient panels produce more electricity with the same amount of sunlight. If a panel produces 320 watts instead of 250 watts for the same amount of aluminum and production process, the solar panel’s carbon footprint will be considerably lower.
3. Your Local Grid Determines Impact
Grid Electricity Sources in Your Area
The carbon intensity of your local electricity grid affects how quickly your solar panels become carbon negative. When your panels generate electricity, they’re displacing power that would otherwise come from your local utility company. The dirtier your local grid, the faster your panels achieve carbon neutrality.
Coal-Heavy Grids = Faster Carbon Payback
If your area relies heavily on coal-fired power plants, your solar panels will offset significantly more carbon emissions per kWh generated. The UK for example depends very little on coal to generate electricity whereas in China 63% of its electricity was generated using coal in 2021. This explains why solar panels installed in coal-dependent regions achieve carbon neutrality much faster than those in areas with cleaner grids.
Natural Gas vs. Renewable Grids
Areas with natural gas-heavy grids offer moderate carbon savings, while regions with hydroelectric or nuclear power see slower carbon payback times. However, even in the cleanest grid regions, solar panels still achieve carbon neutrality within their expected lifespan.
4. Installation Method and System Size
Ground-Mount vs. Roof-Mount Systems
The energy payback time (TEPBT) of grid-connected PV power with crystalline silicon solar modules ranges from 1.6 to 2.3 years, while the GHG emissions now range from 60.1 to 87.3 g-CO2,eq/kW h depending on the installation methods.
Ground-mount systems often have slightly longer carbon payback times due to additional materials required for mounting structures and potentially longer electrical runs. Ground-mount systems can be optimized for perfect sun exposure, which can offset additional materials over time.
System Size and Economies of Scale
Larger solar systems achieve better carbon payback times per kWh generated due to economies of scale. The fixed emissions from system components like inverters and monitoring equipment are spread across more energy production, reducing the per-kWh carbon footprint.
Optimal System Sizing
It’s important your solar panel system is designed appropriately for your situation – too big or too small compared to your energy usage may not be as attractive financially. The same applies to carbon payback – systems sized to match your energy usage optimize financial and environmental returns.
The Bottom Line: Every Factor Matters
While these factors can vary your carbon payback time from 1 to 6 years, the main takeaway is that all solar installations achieve carbon neutrality well within their operational lifetime. Even in the worst-case scenarios, (think cloudy climates with clean grids) solar panels still become carbon negative and provide 20+ years of emissions-free electricity.
Your timeline depends on your unique combination of location, technology, grid conditions, and installation approach. But regardless of these variables, going solar means joining the ranks of technologies that actively remove carbon from the atmosphere for decades to come.

Why Solar’s Carbon Timeline Keeps Improving
The solar industry’s carbon footprint is getting better every year. Three major forces are driving solar panels toward even faster carbon payback times and deeper carbon negativity.
Manufacturing Breakthroughs Are Accelerating Solar manufacturing is becoming more efficient. Researchers have cut the energy needed for the highly intensive Siemens process by around 50% over the past decade. This improvement has been extremely impactful—as production expanded sixfold from 2011 to 2021, energy usage only rose fourfold. That’s remarkable progress while advancing solar technology at breakneck speed.
Manufacturing efficiency improvements aren’t just about using less energy. Two-thirds of recent carbon footprint reductions came from an increase in material efficiency—getting equal or better results while using less material. For example, the amount of silver in each solar cell fell by one-third from 2009 to 2018, as manufacturers found new ways to streamline their products and processes.
Next-Generation Technology Is Game-Changing Revolutionary solar technologies are pushing efficiency to new heights. In early 2025, Trina Solar set a new world record for solar conversion efficiency in n-type fully passivated heterojunction (HJT) solar modules, reaching 25.44%. Higher efficiencies mean each panel generates more clean energy from the same amount of sunlight, offsetting manufacturing emissions faster than ever before.
Perovskite-silicon tandem cells are the next frontier. In June 2024, Chinese solar manufacturer LONGi announced that it’d achieved 34.6% efficiency with a single perovskite-silicon cell. While these breakthrough technologies are still years away from mass production, they promise to reduce the already-short carbon payback times of solar panels.
Recycling Revolution Is Closing the Loop Solar panel recycling is transforming from an afterthought into a sophisticated industry. Research studies conducted on the topic of recycling solar panels have resulted in numerous technologies. Some even reach a 96% recycling efficiency. New methods in solar panel recycling have made great strides in avoiding harmful chemicals, with companies like 9Tech developing innovative methods that recover 99% of solar panel components while avoiding harmful emissions.
The recycling industry is rapidly scaling up. The Solar Panel Recycling Market size is projected to be valued at USD 384.4 million in 2025 and reach USD 548.0 million by 2030. This growth means that by the time today’s solar panels reach end-of-life, there will be infrastructure to recover and reuse their materials, reducing the carbon footprint of future panels.
Making Solar Work for You
Here’s what every North Carolina homeowner needs to know: solar panels become carbon negative in just 1-4 years, then spend the next 20+ years actively removing carbon from the atmosphere. That’s not a future promise—that’s today’s reality.
Your Carbon Impact Starts Day One
- ✅ Immediate Impact: Your panels start offsetting grid emissions from installation day
- ✅ Carbon Neutral: Achieved within 1-4 years depending on your location and system
- ✅ Carbon Negative: 20+ years of pure environmental benefit after payback
- ✅ Measurable Results: A typical solar panel saves over 900kg of CO2 per year
While solar technology improves, today’s panels are already environmental champions. Waiting for “better” technology means missing years of carbon savings that could be happening right now. The best time to go solar is today.
Ready to join the carbon-negative revolution? 8MSolar specializes in residential and commercial solar installations across North Carolina. We engineer complete energy solutions tailored to your specific needs, location, and carbon reduction goals.
Why Choose 8MSolar?
- Local Expertise: We understand North Carolina’s unique solar conditions
- Premium Products: We install only the most efficient, longest-lasting panels
- Engineering Excellence: Our in-house team designs systems optimized for maximum carbon savings
- Transparent Process: We provide detailed projections of your environmental impact
Take Action Today
The math is clear, the technology is proven, and the environmental benefits are immediate. Contact 8MSolar today to discover how quickly your solar installation can become carbon negative and start making a real difference for our planet.
Your clean energy future—and a carbon-negative tomorrow—starts today.